Let's Look at the blueprints...
All data reports brought to you by Eduphoria!
|

|
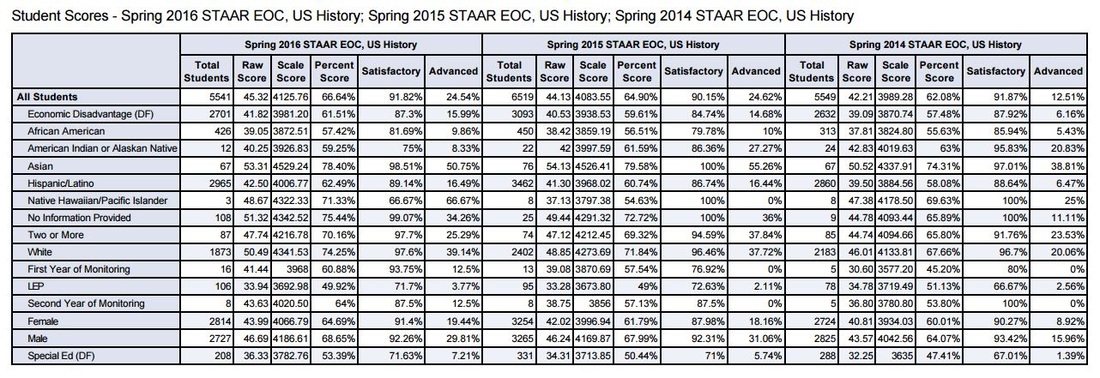
Longitudinal Regional Data with Reporting Categories
1. Which reporting category did the region do the best on? Which one did the region do the worst? Is this what you would have predicted? What does that mean for your instruction next year?
2. Highlight the standards that have been tested every year. What does that mean for your instruction next year?
2. Highlight the standards that have been tested every year. What does that mean for your instruction next year?
Longitudinal Analysis of Student Learning Standards
Using the reports from above and below, answer the following questions.
1. Compare your campus passing percentage from the last 4 test administrations. Are the scores going up or down?
2. What is your Level 2: Phase 2 passing percentage? What does that mean?
3. What is your Commended/ Advanced Percentage? How does that compare to the Region? What does that mean for your instruction next year?
4. What other observations do you have in regards to this data?
2. What is your Level 2: Phase 2 passing percentage? What does that mean?
3. What is your Commended/ Advanced Percentage? How does that compare to the Region? What does that mean for your instruction next year?
4. What other observations do you have in regards to this data?

STAAR/ EOC SE Regional Breakdown by Question
1. Fill out your individual data by question into the chart.
2. Does your data match closely with the region? If not, what was different?
3. Which reporting category did your students do well on? Does that match the Regional data? Does that match the state data?
4. Highlight the 5 lowest performing standards. Does this data surprise you? Why or why not?
5. With a different color, highlight the 5 highest performing standards. Does this data surprise you? Why or why not?
6. Label your lowest 10 standards with an R (Readiness) or an S (Supporting).
7. Out of your lowest 10 standards how many were Readiness and how many were Supporting? What does that mean for your instruction next year?
STAAR/ EOC REGIONAL BREAKDOWN by lowest to highest performing SE
Region 17 Data
- 8th Grade: 7/10 lowest SE's were Readiness Standards
- HS US: 8/10 lowest SE's were Readiness Standards
Dual Coding
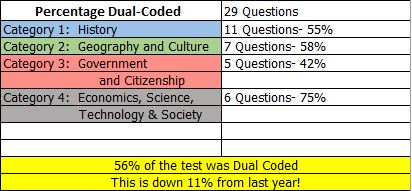
2016 8th Grade STAAR Dual Coded Questions Breakdown
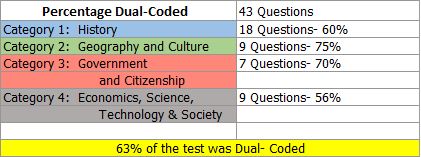
2016 US History EOC Dual Coded Questions Breakdown
1. What does dual coded mean?
2. How did your students do on the dual coded questions?
3. What does that mean for your instruction next year?
2. How did your students do on the dual coded questions?
3. What does that mean for your instruction next year?